<< Lesson 10Lesson 12 >>
Welcome to my number eleven in my series of WebGL tutorials, the first one that isn’t based on the NeHe OpenGL tutorials. In it, we’ll show a texture-mapped sphere with directional lighting, which the viewer can spin around using the mouse.
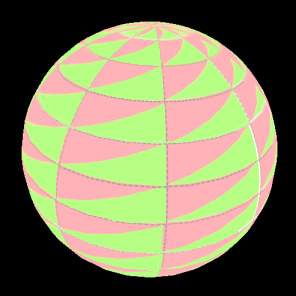
Here’s what the lesson looks like when run on a browser that supports WebGL:
Click here and you’ll see the live WebGL version, if you’ve got a browser that supports it; here’s how to get one if you don’t. You’ll see a white sphere for a few moments while the texture loads, and then once that’s done you should see the moon, with lighting coming from above, to the right, and towards you. If you drag it around, it will spin, with the lighting remaining constant. If you want to change the lighting, there are fields beneath the WebGL canvas that will be familiar from lesson 7.
More on how it all works below…
The usual warning: these lessons are targeted at people with a reasonable amount of programming knowledge, but no real experience in 3D graphics; the aim is to get you up and running, with a good understanding of what’s going on in the code, so that you can start producing your own 3D Web pages as quickly as possible. If you haven’t read the previous tutorials already, you should probably do so before reading this one — here I will only explain the new stuff. The lesson is based on lesson 7, so you should make sure that you understand that one (and please do post a comment on that post if anything’s unclear about it!)
There may be bugs and misconceptions in this tutorial. If you spot anything wrong, let me know in the comments and I’ll correct it ASAP.
There are two ways you can get the code for this example; just “View Source” while you’re looking at the live version, or if you use GitHub, you can clone it (and the other lessons) from the repository there.
As usual, the best way to understand the code for this page is by
starting at the bottom and working our way up, looking at all of the new
stuff as we go. The HTML code inside the <body> tags is no different to lesson 7, so let’s kick off with the new code in webGLStart:
  function webGLStart() {
    canvas = document.getElementById("lesson11-canvas");
    initGL(canvas);
    initShaders();
    initBuffers();
    initTexture();

    gl.clearColor(0.0, 0.0, 0.0, 1.0);

    gl.clearDepth(1.0);

    gl.enable(gl.DEPTH_TEST);
    gl.depthFunc(gl.LEQUAL);

    canvas.onmousedown = handleMouseDown;
    document.onmouseup = handleMouseUp;
    document.onmousemove = handleMouseMove;

    setInterval(tick, 15);
  }
These three new lines allow us to detect mouse events and thus spin the moon when the user drags it around. Obviously, we only want to pick up mouse-down events on the 3D canvas (because it would be confusing if the moon span around when you dragged somewhere else in the HTML page, for example in the lighting text fields). Slightly less obviously, we want to listen for mouse-up and -move events on the document rather than the canvas; by doing this, we are able to pick up drag events even when the mouse is moved or released outside the 3D canvas, so long as the drag started in the canvas — this stops us from being one of those irritating pages where you press the mouse button inside the scene you want to spin, and then release it outside, only to find that when you move the mouse back over the scene the mouse-up has not taken effect and it still thinks you’re dragging stuff around until you click somewhere.
Moving a bit further up through the code, we come to our tick function, which for this page just calls drawScene,
as it has no need to handle keys (because we’re not looking at
key-presses) or to animate the scene (because it only responds to user
input and does no independent animation).
  function tick() {
    drawScene();
  }
The next relevant changes are in drawScene. We start it
off with our boilerplate canvas-clearing and perspective code, then do
the same as we did in lesson 7 to set up the lighting:
  function drawScene() {
    gl.viewport(0, 0, gl.viewportWidth, gl.viewportHeight);
    gl.clear(gl.COLOR_BUFFER_BIT | gl.DEPTH_BUFFER_BIT);

    perspective(45, gl.viewportWidth / gl.viewportHeight, 0.1, 100.0);

    var lighting = document.getElementById("lighting").checked;
    gl.uniform1i(shaderProgram.useLightingUniform, lighting);
    if (lighting) {
      gl.uniform3f(
        shaderProgram.ambientColorUniform,
        parseFloat(document.getElementById("ambientR").value),
        parseFloat(document.getElementById("ambientG").value),
        parseFloat(document.getElementById("ambientB").value)
      );

      var lightingDirection = Vector.create([
        parseFloat(document.getElementById("lightDirectionX").value),
        parseFloat(document.getElementById("lightDirectionY").value),
        parseFloat(document.getElementById("lightDirectionZ").value)
      ]);
      var adjustedLD = lightingDirection.toUnitVector().x(-1);
      var flatLD = adjustedLD.flatten();
      gl.uniform3f(
        shaderProgram.lightingDirectionUniform,
        flatLD[0], flatLD[1], flatLD[2]
      );

      gl.uniform3f(
        shaderProgram.directionalColorUniform,
        parseFloat(document.getElementById("directionalR").value),
        parseFloat(document.getElementById("directionalG").value),
        parseFloat(document.getElementById("directionalB").value)
      );
    }
Next, we move to the correct position to draw the mooon:
    loadIdentity();

    mvTranslate([0, 0, -6]);
…and here comes the first bit that might look odd! For reasons that
I’ll explain a little later, we’re storing the current rotational state
of the moon in a matrix; this matrix starts off as the identity matrix
(ie., we don’t rotate it at all) and then as the user manipulates it
with the mouse, it changes to reflect those manipulations. So, before
we draw the moon, we need to apply the rotation matrix to the current
model-view matrix, which we can do with the multMatrix utility function:
multMatrix(moonRotationMatrix);
Once that’s done, all that remains is to actually draw the moon! This code is pretty standard — we just set the texture then use the same kind of code as we’ve used many times before to tell WebGL to use some pre-prepared buffers to draw a bunch of triangles:
    gl.activeTexture(gl.TEXTURE0);
    gl.bindTexture(gl.TEXTURE_2D, moonTexture);
    gl.uniform1i(shaderProgram.samplerUniform, 0);

    gl.bindBuffer(gl.ARRAY_BUFFER, moonVertexPositionBuffer);
    gl.vertexAttribPointer(shaderProgram.vertexPositionAttribute, moonVertexPositionBuffer.itemSize, gl.FLOAT, false, 0, 0);

    gl.bindBuffer(gl.ARRAY_BUFFER, moonVertexTextureCoordBuffer);
    gl.vertexAttribPointer(shaderProgram.textureCoordAttribute, moonVertexTextureCoordBuffer.itemSize, gl.FLOAT, false, 0, 0);

    gl.bindBuffer(gl.ARRAY_BUFFER, moonVertexNormalBuffer);
    gl.vertexAttribPointer(shaderProgram.vertexNormalAttribute, moonVertexNormalBuffer.itemSize, gl.FLOAT, false, 0, 0);

    gl.bindBuffer(gl.ELEMENT_ARRAY_BUFFER, moonVertexIndexBuffer);
    setMatrixUniforms();
    gl.drawElements(gl.TRIANGLES, moonVertexIndexBuffer.numItems, gl.UNSIGNED_SHORT, 0);
  }
So: how do we create vertex position, normal, texture-coordinate and
index buffers with the correct values to draw a sphere? Conveniently,
that’s the next function up: initBuffers.
It starts off by defining global variables for the buffers, and deciding how many latitude and longitude bands to use, and what the sphere’s radius is. If you were going to use this code in a WebGL page of your own, you’d parameterise the latitude and longitude bands, and the radius, and you’d store the buffers somewhere other than in global variables. I’ve done it this way so as not to impose a particular OO or functional design on you :-)
  var moonVertexPositionBuffer;
  var moonVertexNormalBuffer;
  var moonVertexTextureCoordBuffer;
  var moonVertexIndexBuffer;
  function initBuffers() {
    var latitudeBands = 30;
    var longitudeBands = 30;
    var radius = 2;
So, what are the latitude and longitude bands? In order to draw a set of triangles that are an approximation to a sphere, we need to divide it up. There are many clever ways of doing it, and one simple way based on high school geometry that (a) gets perfectly decent results and (b) I can actually understand without making my head hurt. So here’s that one :-) It’s based on one of the demos on the Khronos website, was originally developed by the WebKit team, and it works like this:
Let’s start by defining the terminology: the lines of latitude are the ones that, on a globe, tell you how far north or how far south you are. The distance between them, as measured along the surface of the sphere, is constant. If you were to slice up a sphere from top to bottom along its lines of latitude, you’d wind up with thin lense-shaped bits for the top and the bottom, and then increasingly thick disc-like slices for the middle. (If this is hard to visualise, imagine slicing a tomato into discs for a salad, but trying to keep the same length of skin from the top to the bottom of each slice. Obviously the slices in the middle would be thicker than those at the top.)
The lines of longitude are different; they divide the sphere into segments. If you were to slice a sphere up along its lines of longitude, it would come apart rather like an orange.
 Now,
to draw our sphere, imagine that we’ve drawn the lines of latitude from
top to bottom, and the lines of longitude around it. What we want to
do is work out all of the points where those lines intersect, and use
those as vertex positions. We can then split each square formed by two
adjacent lines of longitude and two adjacent lines of latitude into two
triangles, and draw them. Hopefully the image to the left makes that a
little bit clearer!
Now,
to draw our sphere, imagine that we’ve drawn the lines of latitude from
top to bottom, and the lines of longitude around it. What we want to
do is work out all of the points where those lines intersect, and use
those as vertex positions. We can then split each square formed by two
adjacent lines of longitude and two adjacent lines of latitude into two
triangles, and draw them. Hopefully the image to the left makes that a
little bit clearer!
The next question is, how do we calculate the points where the lines
of latitude and longitude intersect? Let’s assume that the sphere has a
radius of one unit, and start by taking a slice vertically through its
centre, in the plane of the X and Y axes,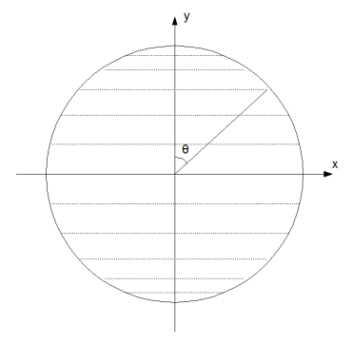 as in the example to the right. Obviously, the slice’s shape is a
circle, and the lines of latitude are lines across that circle. In the
example, you can see that we’re looking at the third latitude band from
the top, and there are 10 latitude bands in total. The angle between
the Y axis and the point where the latitude band reaches the edge of the
circle is θ. With a bit of simple trigonometry, we can see that the
point has a Y coordinate of cos(θ) and an X coordinate of sin(θ).
as in the example to the right. Obviously, the slice’s shape is a
circle, and the lines of latitude are lines across that circle. In the
example, you can see that we’re looking at the third latitude band from
the top, and there are 10 latitude bands in total. The angle between
the Y axis and the point where the latitude band reaches the edge of the
circle is θ. With a bit of simple trigonometry, we can see that the
point has a Y coordinate of cos(θ) and an X coordinate of sin(θ).
Now, let’s generalise that to work out the equivalent points for all lines of latitude. Because we want each line to be separated by the same distance around the surface of the sphere from its neighbour, we can simply define them by values of θ that are evenly spaced. There are π radians in a semi-circle, so in our ten-line example we can take values of θ of 0, π/10, 2π/10, 3π/10, and so on up to 10π/10, and we can be sure that we’ve split up the sphere into even bands of latitude.
Now, all of the points at a particular latitude, whatever their longitude, have the same Y coordinate. So, given the formula for the Y coordinate above, we can say that all of the points around the nth latitude of the sphere of radius one and ten lines of latitude will have the Y coordinate of cos(nπ / 10).
So that’s sorted out the Y coordinate. What about X and Z? Well, just as we can see that the Y coordinate is cos(nπ / 10), we can see that the X coordinate of the point where Z is zero is sin(nπ / 10). 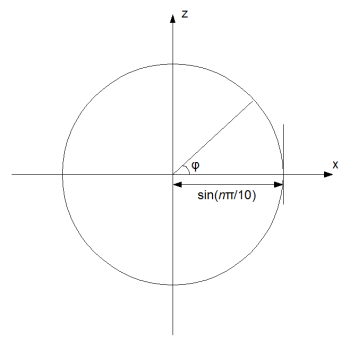 Let’s take a different slice through the sphere, as shown in the
picture to the left: a horizontal one through the plane of the nth latitude. We can see that all of the points are in a circle with a radius of sin(nπ / 10); let’s call this value k.
If we take divide the circle up by the lines of longitude, of which we
will assume there are 10, and consider that there will be 2π radians in
the circle and thus values for φ, the angle we’re taking around the
circle, of 0, 2π/10, 4π/10, and so on, once again by simple trigonometry
we can see that our X coordinate is kcosφ and our Z coordinate is ksinφ.
Let’s take a different slice through the sphere, as shown in the
picture to the left: a horizontal one through the plane of the nth latitude. We can see that all of the points are in a circle with a radius of sin(nπ / 10); let’s call this value k.
If we take divide the circle up by the lines of longitude, of which we
will assume there are 10, and consider that there will be 2π radians in
the circle and thus values for φ, the angle we’re taking around the
circle, of 0, 2π/10, 4π/10, and so on, once again by simple trigonometry
we can see that our X coordinate is kcosφ and our Z coordinate is ksinφ.
So, to generalise, for a sphere of radius r, with m latitude bands and n longitude bands, we can generate values for x, y, and z by taking a range of values for θ by splitting the range 0 to π up into m parts, and taking a range of values for φ by splitting the range 0 to 2π into n parts, and then just calculating:
- x = r sinθ cosφ
- y = r cosθ
- z = r sinθ sinφ
That’s how we work out the vertices. Now, what about the other values we need for each point: the normals and the texture coordinates? Well, the normals are really easy: remember, a normal is a vector with a length of one that sticks directly out of a surface. For a sphere with a radius of one unit, that’s the same as the vector that goes from the centre of the sphere to the surface — which is something we’ve already worked out as part of calculating the vertex’s position! In fact, the easiest way to calculate the vertex position and the normal is just to do the calculations above but not multiply them by the radius, store the results as the normal, and then to multiply the normal values by the radius to get the vertex positions.
The texture coordinates are, if anything, easier. We expect that when someone provides a texture to put onto a sphere, they’ll give us a rectangular image (indeed, WebGL, not to say JavaScript, would probably be confused by anything else!). We can safely assume that this texture is stretched at the top and the bottom, following the Mercator projection. This means that we can split up the left-to-right u texture coordinate evenly by the lines of longitude and the top-to-bottom v by lines of latitude.
Right, that’s how it works — the JavaScript code should now be
incredibly easy to understand! We just loop through all of the
latitudinal slices, then within that loop we run through the
longitudinal segments, and we generate the normals, texture coordinates,
and vertex positions for each. The only oddity to note is that our
loops terminate when the index is greater than the number of longitudinal/latitudinal lines — that is, we use <= rather than <
in the loop conditions. This means that for, say, 30 longitudes, we
will generate 31 vertices per latitude. Because the trigonometric
functions cycle, the last one will be in the same position as the first,
and so this gives us an overlap so that everything joins up.
    var vertexPositionData = [];
    var normalData = [];
    var textureCoordData = [];
    for (var latNumber = 0; latNumber <= latitudeBands; latNumber++) {
      var theta = latNumber * Math.PI / latitudeBands;
      var sinTheta = Math.sin(theta);
      var cosTheta = Math.cos(theta);

      for (var longNumber = 0; longNumber <= longitudeBands; longNumber++) {
        var phi = longNumber * 2 * Math.PI / longitudeBands;
        var sinPhi = Math.sin(phi);
        var cosPhi = Math.cos(phi);

        var x = cosPhi * sinTheta;
        var y = cosTheta;
        var z = sinPhi * sinTheta;
        var u = 1 - (longNumber / longitudeBands);
        var v = 1 - (latNumber / latitudeBands);

        normalData.push(x);
        normalData.push(y);
        normalData.push(z);
        textureCoordData.push(u);
        textureCoordData.push(v);
        vertexPositionData.push(radius * x);
        vertexPositionData.push(radius * y);
        vertexPositionData.push(radius * z);
      }
    }
Now that we have the vertices, we need to stitch them together by generating a list of vertex indices that contains sequences of six values, each representing a square expressed as a pair of triangles. Here's the code:
    var indexData = [];
    for (var latNumber = 0; latNumber < latitudeBands; latNumber++) {
      for (var longNumber = 0; longNumber < longitudeBands; longNumber++) {
        var first = (latNumber * (longitudeBands + 1)) + longNumber;
        var second = first + longitudeBands + 1;
        indexData.push(first);
        indexData.push(second);
        indexData.push(first + 1);

        indexData.push(second);
        indexData.push(second + 1);
        indexData.push(first + 1);
      }
    }
This is actually pretty easy to understand. We loop through our vertices, and 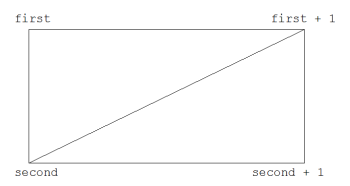 for each one, we store its index in
 first, and then count longitudeBands + 1
indices forward to find its counterpart one latitude band down — adding
the one because of the extra vertices we had to add to allow for the
overlap — and store that in second. We then generate two triangles, as in the diagram.
Right — that's the difficult bit done (at least, the bit that's difficult to explain). Let's move on up the code and see what else has changed.
Immediately above the initBuffers function are the three
functions that deal with the mouse. These deserve careful
examination... Let's start by carefully considering what we're aiming to
do. We want the viewer of our scene to be able to rotate the moon
around by dragging it. A naive implementation of this might be to have,
say, three variables representing rotations around the X, Y and Z axes.
We could then adjust each one appropriately when the user dragged the
mouse. If, say, they dragged it up or down, we could adjust the
rotation around the X axis, and if it was from side to side, we could
adjust it around the Y axis. The problem with doing things this way is
that when you're rotating an object around various axes, and you're
doing a number of different rotations, it matters what order you apply
them in. Let's say the viewer rotates the moon 90° around the Y axis,
then drags the mouse down. If we rotate around the X axis as planned,
they will see the moon rotate around what is now the Z axis; the first
rotation rotated the axes as well. This will look weird to them. The
problem only gets worse when the viewer has, say, rotated 10° around the
X axis, then 23° around the rotated Y axis, and then... we could put
in all kind of clever logic to say something like "given the current
rotational state, if the user drags the mouse downwards then adjust all
three of the rotation values appropriately". But an easier way of
handling this would be to keep some kind of record of every rotation
that the viewer has applied to the moon, and then to replay them every
time we draw it. On the face of it, this might sound like an expensive
way of doing things, unless you remember that we already have a
perfectly good way of keeping track of a sequence of different
geometrical transforms in one place and applying them in one operation: a
matrix.
We keep a matrix to store the current rotation state of the moon, logically enough called moonRotationMatrix.
When the user drags the mouse around, we get a sequence of mouse-move
events, and each time we see one we work out how many degrees of
rotation around the current X and Y axes as seen by the user that
drag amounts to. We then calculate a matrix that represents those two
rotations, and pre-multiply the moonRotationMatrix by it —
pre-multiplying for the same reason as we apply transformations in
reverse order when positioning the camera; the rotation is in terms of
eye space, not model space. (A note for readers — I'm sure there's a
better way of explaining that, but don't want to delay posting this
until I've had the moment of clarity required :-) Any suggestions on
better phrasing would be gratefully received!)
So, with all that explained, the code below should be pretty clear:
  var mouseDown = false;
  var lastMouseX = null;
  var lastMouseY = null;

  var moonRotationMatrix = Matrix.I(4);

  function handleMouseDown(event) {
    mouseDown = true;
    lastMouseX = event.clientX;
    lastMouseY = event.clientY;
  }

  function handleMouseUp(event) {
    mouseDown = false;
  }

  function handleMouseMove(event) {
    if (!mouseDown) {
      return;
    }
    var newX = event.clientX;
    var newY = event.clientY;

    var deltaX = newX - lastMouseX
    var newRotationMatrix = createRotationMatrix(deltaX / 10, [0, 1, 0]);

    var deltaY = newY - lastMouseY;
    newRotationMatrix = newRotationMatrix.x(createRotationMatrix(deltaY / 10, [1, 0, 0]));

    moonRotationMatrix = newRotationMatrix.x(moonRotationMatrix);

    lastMouseX = newX
    lastMouseY = newY;
  }
That's the last substantial bit of new code in this lesson. Moving
up from there, all of the changes you can see are that the code to
create a rotation matrix has been moved out to its own function so that
it can be used in handleMouseMove (previously there was
just a single function to create a rotation matrix and then immediately
apply it to the model-view matrix), and then the changes required to our
texture code to load up the new texture into the changed variable
names.
That's it! You now know how to draw a sphere using a simple but effective algorithm, how to hook up mouse events so that viewers can drag to manipulate your 3D objects, and how to use matrices to represent the current rotational state of an object in a scene.
That's it for now; the next lesson will show a new kind of lighting: point lighting, which comes from a particular place in the scene and radiates outwards, just like the light from a bare light bulb.
Acknowledgments: The texture-map for the moon comes from NASA's JPL website. The code to generate a sphere is based on this demo, which was originally by the WebKit team. Many thanks to both!


Somehow, I can’t see anything in Safari. There’s no error message though.
I’m seeing the same. Webkit doesn’t seem to want to render this example.
Rather, I’m getting a black screen, so I assume we’re initializing OpenGL right. But, no errors in the console.
Thanks for letting me know — I’m looking into it. It worked when I tested it on Chrome on a PC, so presumably it’s not WebKit per se that’s the problem. However, I’ve just got my hands on a Mac, so let me see if that’s the cause.
Hmm, seems to work on Minefield on a Mac. So it’s not a Mac-specific problem either. Odd.
Chromium on the same Mac gives an “Oh, Snap!” error page for any WebGL content I try, so no clues there…
OK, it’s last thing on a Friday night so I’ll sleep on this and hopefully fix it tomorrow. Until then, I recommend using Minefield.
Nice tutorial!
One suggestion: for such examples without objects that move continuous only call tick() on mouse events and init. Browser users will be happy and your scene will draw a bit snappier for big scenes because the new data can be rendered directly instead of waiting on the previous to be drawn.
That’s a good idea — I’ll take a look, just in case there are non-obvious knock-on effects, but perhaps I could go back and simply lessons 1-3 by doing that too.
Hi Giles,
I agree to aa. I was just working on the same “problem”. Minefield keeps approx 20% of my QuadCore busy when your moon sample is active. What I did is to call drawScene on the events mouseWheel (zooming) and keyDown.
I would not recommend to do it on mouseMove because of it’s sometimes high frequency. Instead I call setInterval(drawScene,40) in mouseDown and clearInterval in mouseUp.
This lets the CPU usage go down to ~0 if the mouse it not dragging the WebGL-stuff and gives a fluent movement otherwise.
Here is the exclusive preview: http://www.peter-strohm.de/webgl/kapitel5.html
(I do not claim that this is the only or best solution, but it works fine for me.)
Thanks, Peter — that sounds like an excellent compromise. Time for another round of retrospective changes to the lessons!
BTW if anyone using Safari is still reading the comments here, I’ve just made a fix to the sphere-drawing code which might make things work for you. I’d be grateful for any reports on whether this one works for you.
Safari/Mac: I can see a round white circle in a black box, and from the movement of the edges it is rotating in response to mouse movements. It is lacking a texture and I can’t see if lighting is working.
Thanks, steve. How long did you leave the page open? I suspect (from your email address) that the speed of the connection between my server and your computer might be slow, and the texture is quite big, so perhaps it just takes too long to load. If so, you should see it appear after a few minutes, and if that turns out to be the case then perhaps I should make the texture smaller and perhaps also add some kind of status code so that people know what’s going on.
Looks like the texture downloaded, but I’m still seeing a mostly white globe on TOT WebKit, with some sprinkles of color here and there. Other sites have had problems because of some errors in the GLSL. I think the Mac might be more picky about GLSL errors. Are you checking the return of compileShader? If it finds an error, the error message is (usually) pretty descriptive.
Hi Chris,
Thanks for that. I’m using this code:
gl.compileShader(shader);
if (!gl.getShaderParameter(shader, gl.COMPILE_STATUS)) {
alert(gl.getShaderInfoLog(shader));
return null;
}
…so that should do the job if there’s an error — I think it did pick up a bug in one of my other shaders where the Mac complained about a “1″ where I should have used a “1.0″, so if it were a syntax problem I’d expect you’d have seen something. OTOH, if it’s a non-syntactic bug — some kind of overflow or something — I guess it won’t pick it up.
I hope to have access to a MacBook Air later on this evening, so I’ll see if I can repro it there.
Cheers,
Giles
Tracked it down. Looks like WebKit can’t handle PNG textures, or at least not the specific PNGs I was using. Switching to GIF fixed the problem on the MacBook air I was using — feedback from people using other Macs very much welcome!
Instead of spinning the moon, I’m trying to create a camera that spins around the center of the scene, but I’m quite confused. Could you do a tutorial on free camera movement soon, or at least give general pointers on how to modify this example?
Sure, that’s something I’ve been aiming to do for a while. I’m looking at a couple of things related to render-to-texture first — picking and probably shadows — but will focus (sorry ;-) on camera next.
Two hints that might be useful to you in the meantime: firstly, if the camera is at location x, y, z with a particular rotation matrix, you position it by setting the model-view matrix to the inverse of the rotation matrix, and then translating by -x, -y, -z. Secondly, you’ll need to apply the model-view matrix as it is at that point to the point lighting location (or a modified version of it to the non-point diffuse lighting location). That’s best done in JavaScript before you push it up to the shaders.
Obviously I’ll go over both those points in more depth in the full tutorial, but if either needs clarification now, let me know in a comment here and I’ll try to explain more.
My current problem now is that I don’t understand how to correctly rotate the camera’s position around the origin. I tried using the rotation matrix that is updated in the handleMouseMove function, but somehow the result of cameraPosition = newRotationMatrix.multiply(cameraPosition); isn’t even a vector anymore…
That’s very strange! I don’t quite know why that might be.
The way I would think about it is that the camera’s state is defined by a position and a rotation matrix. If you want it to orbit an object, you need to update both. You can work out the position change by drawing a tangent to the circle you’re orbiting in. The change in the rotation state you could get by generating a matrix for the number of degrees that you’re moving around the orbit, but in the opposite direction, and then applying that to the camera’s existing rotation matrix.
Does that help at all?
Is there any light arcball implementation for webgl?
Not that I’ve seen, though it should be pretty easy to implement from Nehe #48.
Is it possible to fill the color rather than map a texture?
I have tried it but failed. It only shows a multi-color sphere.
Do you mean a sphere that’s all the same colour? That should work fine.
Yes. However, I fail to do it. I have posted the coding in the OpenGL forum and hope someone can help me to solve the problem.
http://www.opengl.org/discussion_boards/ubbthreads.php?ubb=showflat&Number=284142#Post284142
The moon demo looks fine to me on my Mac 10.6.5 system on WebKit nightly, Chromium 9.0.595.0 (67428), latest Minefield 4.0b8pre
Hi Stephen — thanks! Sounds like things have stabilised and all of the tutorials should now work.
If you find the math confusing, there is an excellent and up-to-date book available online for free by professor Paul Dawkins who teaches at Lamar University in Texas. Here is the chapter from Calculus II that explains spherical coordinates thoroughly:
http://tutorial.math.lamar.edu/Classes/CalcII/SphericalCoords.aspx
If you do not have a mathematical background, looking at the previous chapters of the same book may help you refresh your memory in trigonometry and functions. Also, the other books that are available online for free by him, such as his algebra and trigonometry review book can be of great assistance in case you need to freshen up your high school math:
http://tutorial.math.lamar.edu/Extras/AlgebraTrigReview/AlgebraTrigIntro.aspx
All of his work is excellent and well-written, with many examples, clear language, and a considerable amount of figures which all make everything easier to understand. If you’re serious about doing 3d graphics, reading a little bit of math will help you tremendously in your endeavor. It is a long-term investment.
Many thanks for the links, Dionysis — I’ll check them out.
Dear Giles, I just discovered this excellent site. Would you be willing to make a demo that functions just like this one, but displays a large number of data points (particles?) placed about in 3 dimensions instead of the moon? Basically I want a utility to plot actual data. I have no javascript programming experience, but I am usually able to modify existing code of any kind to get the results I want. Let me know what you think!
Hi Erik, glad you like the site! That’s a nice idea for a demo, I’ll add it to my list — though be warned, there’s a lot of stuff I want to do and I’ve got depressingly little time right now :-( If you wanted to give it a try yourself, you could copy lesson 1, strip out the triangle, then put the data into the square’s vertex position buffer and then draw it using something like this:
gl.drawArrays(gl.POINTS, 0, squareVertexPositionBuffer.numItems);
That would probably get you started.
First off, great site! Has helped me immensely in getting up to speed and creating a few demos.
I have a question about the actual texture file used for this sphere. Its seem that it will only work with 1024×512 or multiples of that. I’ve tried other sizes with one half the other but to no avail. I’m not too familiar with image files and such but I was wondering if you could shed some light on this.
Hi Stephen — thanks! That’s the power-of-two texture issue. I need to make that clearer somewhere in the tutorials..